USGS’s first half 2026 U.S. cement shipments data was recently released. The data showed a 5.1% gain over depressed 2025 levels. According to various cement company financial reports several factors contributed to the strong market performance, including favorable weather comparisons, large backlogs associated with infrastructure projects, and robust growth in data center and utility/power construction.
Curiously, this market strength was characterized by prices that were at best flat — at a time when imports’ supply to the market were also in retreat. In the end, year growth, and implications for 2027, will vary widely by state and region depending on the composition and characteristics of demand within each area.
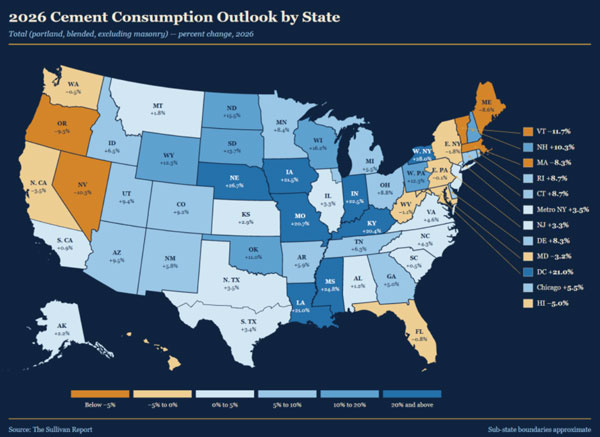
Consider the following assessments regarding near-term growth. In terms of shipments through the first half of the year, the North Central (+16.2%), Great Lakes (+13.3%), New England and Mid-Atlantic states (+9.1%) showed the most robust growth. Southern Central states also recorded strong growth (+6.6%), as did the South Atlantic region (+5%). More modest growth characterized East South Central (+3%) and the West Coast (1.6%).
Weather
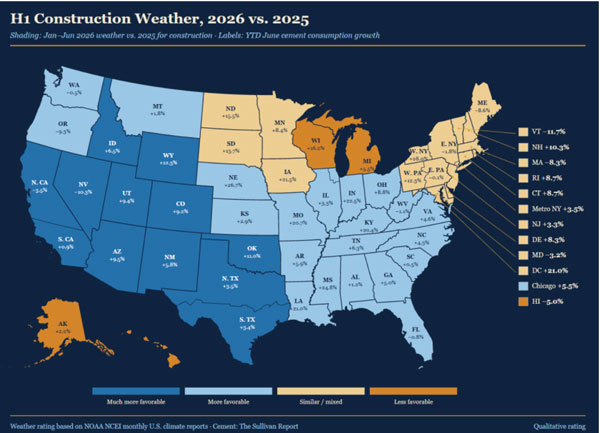
Comparatively, favorable weather conditions gave first-half 2026 cement consumption a meaningful lift. January 2025 was the coldest in more than three decades, and that spring brought heavy rain and flooding across the South and Ohio Valley.
By contrast, January-March 2026 was the driest on record nationally, and January-April the warmest. The largest weather gains came in the Mountain West, Southwest, Texas, Oklahoma and the Deep South.
Because favorable weather largely pulls work forward rather than expanding it, some first-half strength is likely to come out of the second half, particularly where the early-year weather advantage was greatest. According to my calculations, favorable early-year weather pulled roughly 2% of future cement volume into the first half.
Some of that payback likely surfaced in the second quarter. The remainder should subtract an estimated 0.5 to 1.5 percentage points from second-half growth, leaving the full-year weather effect near neutral and adding to second-half headwinds.
Data Center and Utility Construction
First-half strength from the private sector was significant and focused on sectors less sensitive to increases in interest rates and overall cyclical economic conditions. Real data center construction spending reflected an estimated 24% year-over-year growth rate during the first half of the year.
Spending on utility and power construction also showed significant strength. While not-in-my-back-yard (NIMBY) efforts can delay or even reduce data center construction activity, it is likely that those potential adverse impacts will occur in later years and that near-term projects will be largely unaffected.
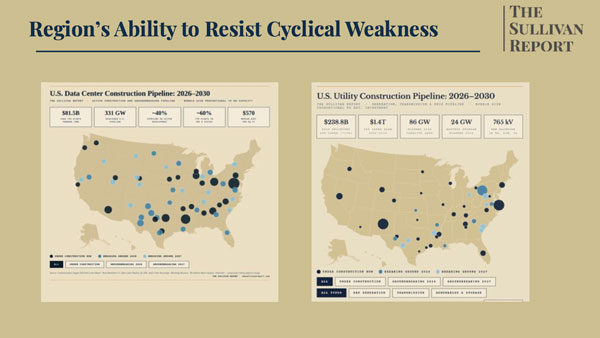
Given this, no significant let-up in data center or utility construction is expected during the second half of 2026 or during 2027. Indeed, the first two months of the third quarter showed an acceleration in data center spending growth to an estimated 48% rate.
Similarly, spending on utility and power construction increased at a 10% year-over-year rate. It is important to keep in mind both these construction spending sectors require tremendous amounts of cement and concrete.
Cement intensities are at their highest during the early stages of projects when foundations are being poured. Furthermore, the cement consumed by a single large hyperscale data center can equal a meaningful share of a state’s annual consumption and generate very strong growth rates.
Because that demand is compressed into the foundation phase, it can deliver a sharp but temporary boost to regional consumption. Once the foundation phase passes, growth rates call fall quickly — even though the project continues.
Based on an evaluation of data center project vintage (when projects were initiated) suggests the foundation phase is still strong. On a state basis dependent on specific large projects, however, it can reflect a dramatic reversal in cement consumption growth rates.
Infrastructure Uncertainty and Backlogs
The Infrastructure, Investment and Jobs Act (IIJA) has expired and is now being extended by Congress’ continuing resolution (CR). Under the CR, state departments of transportation typically hesitate on initiating new projects.
This, coupled with the loss of Division J funds that account for roughly $118 billion during the life of the act, suggests a slowdown in infrastructure spending should eventually materialize. If the CR is extended long enough, this will adversely impact infrastructure spending and undermine one of the key factors responsible for first half 2026 growth.
Look for a forthcoming report on data center activity by stage of construction and the implication it has on state cement consumption growth for the 2026-2027 outlook.
Aside from conservation water projects, real public construction activity is expected to ease through the remainder of 2026. Since the first quarter of 2026, highway spending has shown year-over-year real spending declines.
While growth continues to characterize the water and sewer construction, the pace of growth has eased. Further easement is expected through the remainder of the year and through 2027. That assessment is based on the assumption that the CR continues though September 2027.
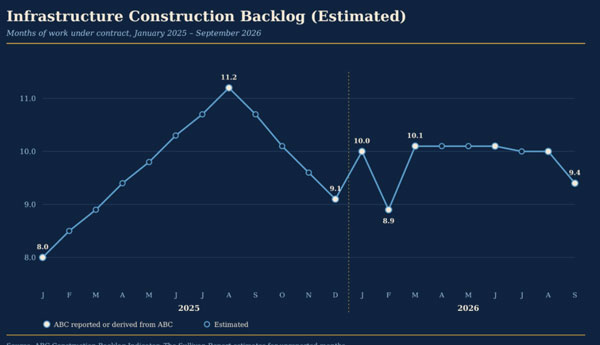
Strong infrastructure spending provided important support to first-half activity. Unfortunately, new government spending seems to have slowed. Contractor infrastructure project backlogs that provided support for highway spending amid delays in replacing IIJA may be fading. Infrastructure backlog eased from 10.1 months supply to an estimated 9.4 months in September as contractors worked off existing projects without replacements.
Furthermore, real highway put-in-place spending has declined on a year- over-year basis by an average 8% since April.
Improving Economic Conditions Turn Bad
At the start of the year, economic conditions were improving. Inflation was declining and at a sub-3% level. The path pointed to further improvement. Interest rates were following the lead of inflation.
Mortgage rates, for example, dipped below 6%. Residential was set for a significant recovery and the basis for correction among traditional nonresidential sectors was also in the near-term cards.
Positive developments regarding the macro-economy supported a construction spending recovery early in the year. And then the conflict with Iran changed everything. Shipping through the Strait of Hormuz became restricted. The world’s supply of oil temporarily declined by roughly 20%. Oil prices rose and ignited inflationary pressures. Interest rates followed — to the detriment of private construction activity.
At first, many expected it was going to be a quick and temporary distraction to the growth momentum that was taking root. It was another Venezuela. Initially, investment and spending decisions were not impacted and the momentum established early in the year.
Construction spending decisions were slow to reflect the critical changes in the economic environment to manifest itself in construction activity. The first half momentum did not completely dissipate until July and August and did not affect in the first half numbers.
Lacking an agreement to stop hostilities and provide unhindered flow of shipping through the Strait of Hormuz, oil prices, inflation and interest rates will remain elevated — to the detriment of overall economic growth and private construction activity. Indeed, since the conflict began, mortgage rates increased by 140 basis points (BP). Further increases could materialize by year-end and into 2027.
At such high interest rates, commercial loans up for renewal could have trouble refinancing – giving rise to the “maturity wall.” The longer the conflict endures, the greater the adverse momentum characterizes the economy and construction activity.
Lacking a clear exit strategy, there is a good chance that the conflict will continue through the end of 2027. That suggests the headwinds facing construction will strengthen and prompt a more powerful slowing of the private sector construction activity, excluding data centers and utilities.
It is important to recognize this assessment carries significant uncertainty. A near-term resolution to the conflict could result in a rapid decline in oil prices, inflationary pressures and a gradual easing in interest rates. Such a development does little to change the 2026 outlook but adds significant upside potential to the 2027 outlook.
Growth or Decline
The current cement market is in transition — reflecting first half strength against second half weakening. The strong growth registered during the first half of the year will be difficult to offset given data center and utility construction activity and the existence of large, albeit waning, infrastructure backlogs.
It is likely that most of the private construction sector will face increasingly hostile conditions for the remainder of this year and next. At issue is whether the second half weakness expected among most of the private sector, will be enough to offset the first half strength. July and August real construction each declined roughly 1.5% year-over- year.
Getting to a flat or negative cement consumption growth rate for the year means that real construction spending during September through December must decline at a rate of at least 3.5-4% compared to year earlier levels (roughly flat in nominal terms).
Further, it requires a meaningful decline in cement intensities. Frankly, that’s a steep deceleration in four months. The more likely result is an end-year result of roughly +0.5% to +1.5% for the year — a saddle year.
Assuming no accord is reached in the Middle East, the intensification of economic headwinds is expected to materialize, to the detriment of construction spending in 2027. The continuation of strong data center and utility construction activity will limit the severity of any decline. Without question the market performance for cement consumption will vary by region.
The U.S. market will become further bifurcated by region and split between states completely reliant on traditional private construction versus states that experience strong data center and utility construction activity. With the likely continuation of the CR, public construction activity will struggle to be a neutral influence on 2027 cement consumption.
For more information, go to www.thesullivanreport.com.